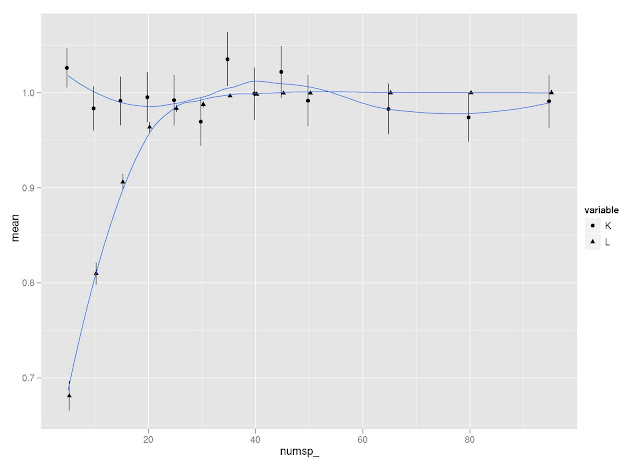
I did a little simulation to examine how K and lambda vary in response to tree size (and how they compare to each other on the same simulated trees). I use Liam Revell’s functions fastBM to generate traits, and phylosig to measure phylogenetic signal.
Two observations:
- First, it seems that lambda is more sensitive than K to tree size, but then lambda levels out at about 40 species, whereas K continues to vary around a mean of 1.
- Second, K is more variable than lambda at all levels of tree size (compare standard error bars).
Does this make sense to those smart folks out there?
#### Simulations
install.packages(c("ape","reshape2","ggplot2"))
require(ape); require(reshape2); require(ggplot2)
source("http://anolis.oeb.harvard.edu/~liam/R-phylogenetics/phylosig/v0.3/phylosig.R")
source("http://anolis.oeb.harvard.edu/~liam/R-phylogenetics/fastBM/v0.4/fastBM.R")

# Simulation function physig_sim
# input: x = number of species in tree
# output: a vector length two with (K, lamba)
physig_sim <- function(x) {
tree <- rcoal(x)
traits <- fastBM(tree)
physig_k <- phylosig(tree, traits, method = "K")
physig_l <- phylosig(tree, traits, method = "lambda")$lambda
sigs <- c(physig_k, physig_l)
return(sigs)
}

# Run simulation
spnumbs <- c(5, 10, 15, 20, 25, 30, 35, 40, 45, 50, 65, 80, 95)
rands <- 1000
siglist <- alply( spnumbs, 1, function(x) t(replicate(rands, physig_sim(x))), .progress="text")
sigdf <- as.data.frame(do.call(rbind, siglist))
names(sigdf) <- c("K", "L")
sigdf$numsp_ <- rep(spnumbs, each=rands)
sigdf_m <- melt(sigdf, id = 3)

# Plot results
plotdf <- ddply(sigdf_m, .(numsp_, variable), summarise,
mean = mean(value),
se = sd(value)/sqrt(length(value))
)
limits <- aes(ymax = mean + se, ymin = mean - se)
dodge <- position_dodge(width=0.9)
ggplot(plotdf, aes(x = numsp_, y = mean, shape = variable)) +
geom_point(position=dodge) +
geom_errorbar(limits, position=dodge, width=0.25) +
geom_smooth()
ggsave("physig_sim.jpeg")