So OpenCPU is pretty awesome. You can run R in a browser using URL calls with an alphanumeric code (e.g., x3e50ee0780) defining a stored function, and any arguments you pass to it.
Go here to store a function. And you can output lots of different types of things: png, pdf, json, etc - see here.
Here’s a function I created (originally from https://gist.github.com/2602432):
# Store a function with man lines
# Go Here: http://beta.opencpu.org/apps/opencpu.demo/storefunction/
# number: x3e50ee0780
# link: http://beta.opencpu.org/R/call/store:tmp/x3e50ee0780/png?id='ropensci'&type='org'
the <- function (id = 'hadley', type = 'user')
{
  require(RCurl); require(RJSONIO); require(ggplot2); require(reshape2); require(plyr)
  if(type == 'user'){ url = "https://api.github.com/users/" } else
    if(type == 'org'){ url = "https://api.github.com/orgs/" } else
      stop("parameter 'type' has to be either 'user' or 'org' ")
  url2 <- paste(url, id, "/repos?per_page=100", sep = "")
  xx <- getURL(url2)
  tt <- fromJSON(xx)
  if(!length(tt) == 1) { tt <- tt } else
    { stop("user or organization not found - search GitHub? - https://github.com/") }
  out <- ldply(tt, function(x) t(c(x$name, x$forks, x$watchers)))
  names(out) <- c("Repo", "Forks", "Watchers")
  out$Forks <- as.integer(out$Forks)
  out$Watchers <- as.integer(out$Watcher)
  out2 <- melt(out, id = 1)
  out2$value <- as.numeric(out2$value)
  out2$Repo <- as.factor(out2$Repo)
  repoorder <- unique(out2[order(out2$value, decreasing=FALSE),][,1])
  out2$Repo <- factor(out2$Repo, levels = repoorder)
  ggplot(out2, aes(Repo, value)) + geom_bar() + coord_flip() +
    facet_wrap(~variable) + theme_bw(base_size = 18)
}
the() # default for hadley
the(id='defunkt', type='user') # works - a user with even more repos than Hadley
the(id='ropensci', type='org') # works - organization example
the(id='jeroenooms', type='user') # works - organization example
the(id='SChamberlain', type='org') # error message - mismatch of username with org type
the(id='adsff', type='user') # error message - name does not exist
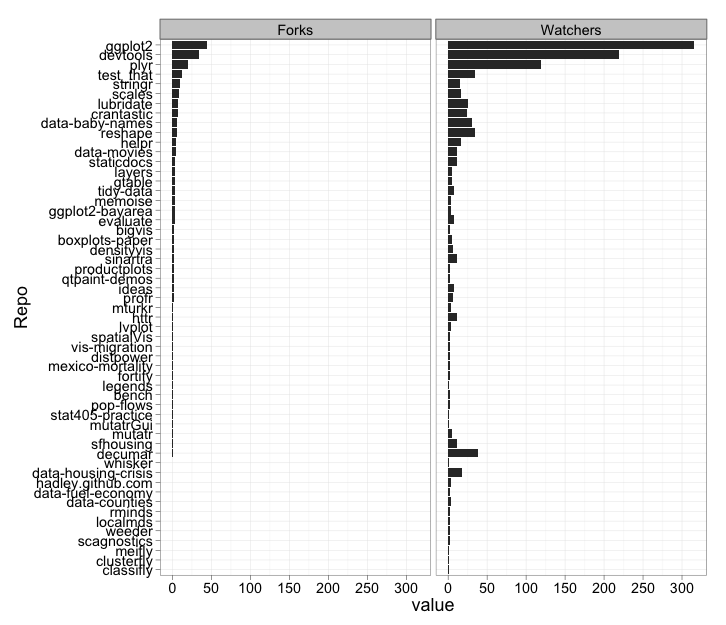
It makes a ggplot2 graphic of your watchers and forks on each repo (up to 100 repos), sorted by descending number of forks/watchers.
Here’s an example from the function. Paste the following in to your browser and you should get the below figure.
http://beta.opencpu.org/R/call/opencpu.demo/gitstats/png
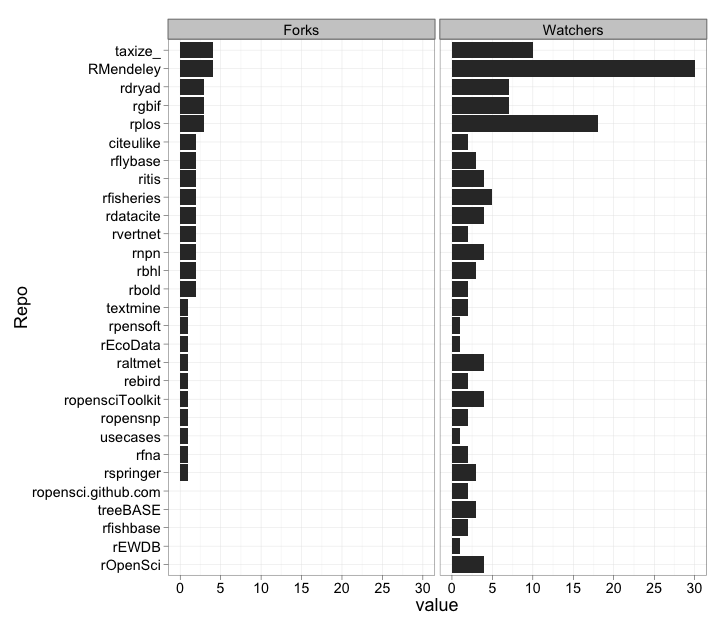
And you can specify user or organization name using arguments in the URL
http://beta.opencpu.org/R/call/opencpu.demo/gitstats/png?type='org'&id='ropensci'
Sweet. Have fun.