This blog has lasted a whole year already. Thanks for reading and commenting.
There are a couple of announcements:
- Less blogging: I hope to put in many more years blogging here, but in full disclosure I am blogging for Journal of Ecology now, so I am going to be (and already have been) blogging less here.
- More blogging: If anyone wants to write guest posts at Recology on the topics of using R for ecology and evolution, or open science, please contact me.
- Different blogging: I was going to roll out the new dynamic views for this blog, but Google doesn’t allow javascript, which is how I include code using GitHub gists. Oh well…
Anywho, here is the breakdown of visits to this blog, visualized using #ggplot2, of course. There were a total of about 23,000 pageviews in the first year of this blog.
Here is the pie chart code I used:
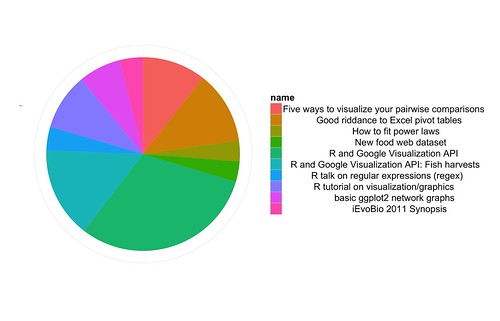
Visits to top ten posts:
Visits by by pages:

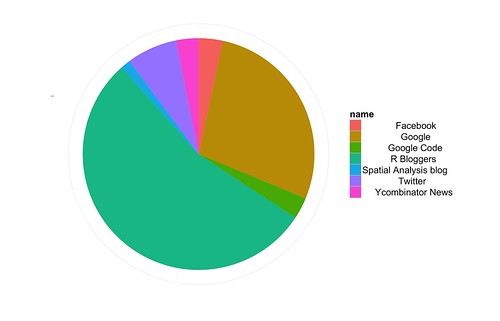
Visits by top referring sites:
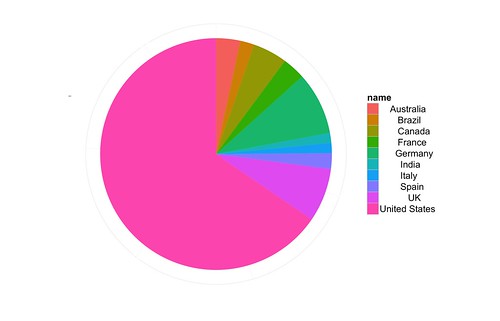
Visits by country:
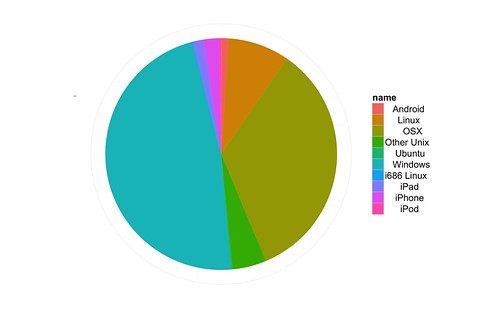
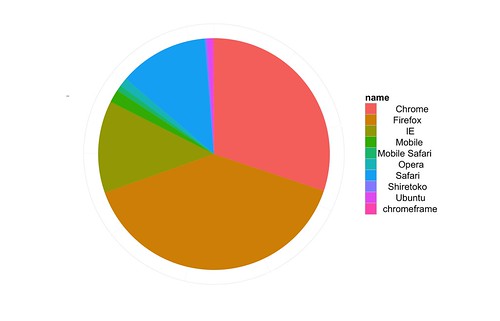
Visits by browsers:
Visits by operating system: