There is a new R package in town, mvabund, which does, as they say “statistical methods for analysing multivariate abundance data”. The authors introduced the paper in an online early paper in Methods in Ecology and Evolution here, R package here.
The package is meant to visualize data, fit predictive models, check model assumptions, and test hypotheses about community-environment associations.
Here is a quick example (originally from https://gist.github.com/2112141)
#### mvabund play
# install mvabund from CRAN pkg repository
install.packages("mvabund")
require(mvabund)
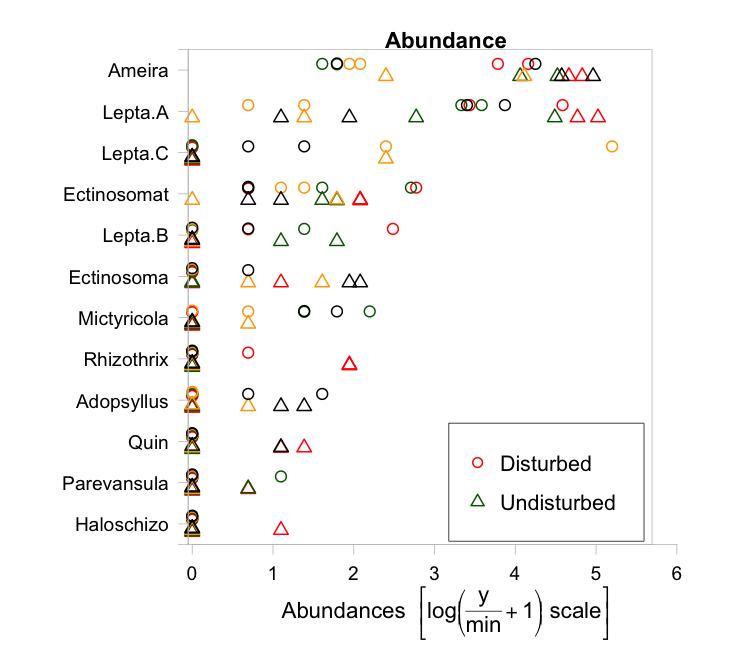
# plot abundance by copepod species
data(Tasmania)
attach(Tasmania)
tasmvabund <- mvabund(Tasmania$copepods)
plot(tasmvabund ~ treatment, col = as.numeric(block))
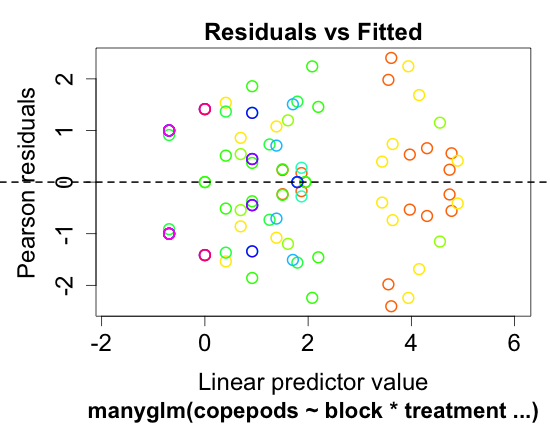
# fit negative binomial model for each species and plot residuals vs. fitted
tas.nb <- manyglm(copepods ~ block*treatment, family="negative.binomial")
plot(tas.nb)