We (rOpenSci) started a repo to wrap the API for VertNet, an open access online database of vertebrate specimen records across many collection holders. Find the open source code here - please contribute if you are so inclined. We had a great Google Summer of Code student, Vijay Barve contributing to the repo this summer, so it is getting close to being CRAN-able.
Most of the functions in the repo get you the raw data, but there were no functions to visualize the data. Since much of the data records of latitude and longitude data, maps are a natural visualization to use.
What follows is a quick example of using the basic vertmap function.
Install rvertnet
# install_github('rvertnet', 'ropensci') # uncomment if not installed
# already
library(rvertnet)
Get data
out <- vertoccurrence(q = "larva", num = 100)  # get records on keyword 'larva', limit to 100
nrow(out)  # how many rows?
[1] 100
Map
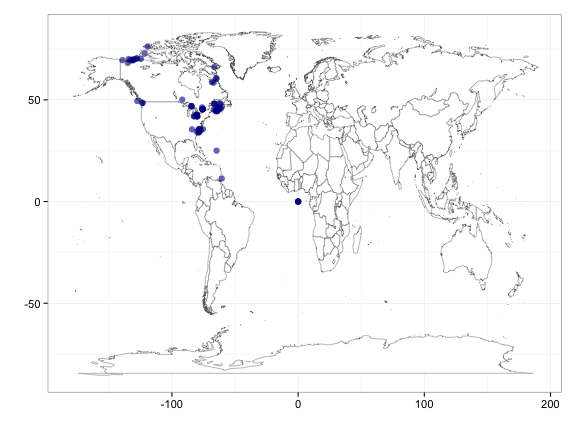
Now map it using vertmap. This is a very basic function: it simply cleans up the input data.frame, removing rows without lat/long data, and providing warnings when the input data.frame is not in the correct format. vertmap uses the ggplot2 framework for the map. If you want to make you own map please do so - this is just a simple fxn to get you started if you want to take a quick look at the data.
vertmap(input = out) # make a map using vertmap
Get the .Rmd file used to create this post at my github account - or .md file.
Written in Markdown, with help from knitr, and nice knitr highlighting/etc. in in RStudio.